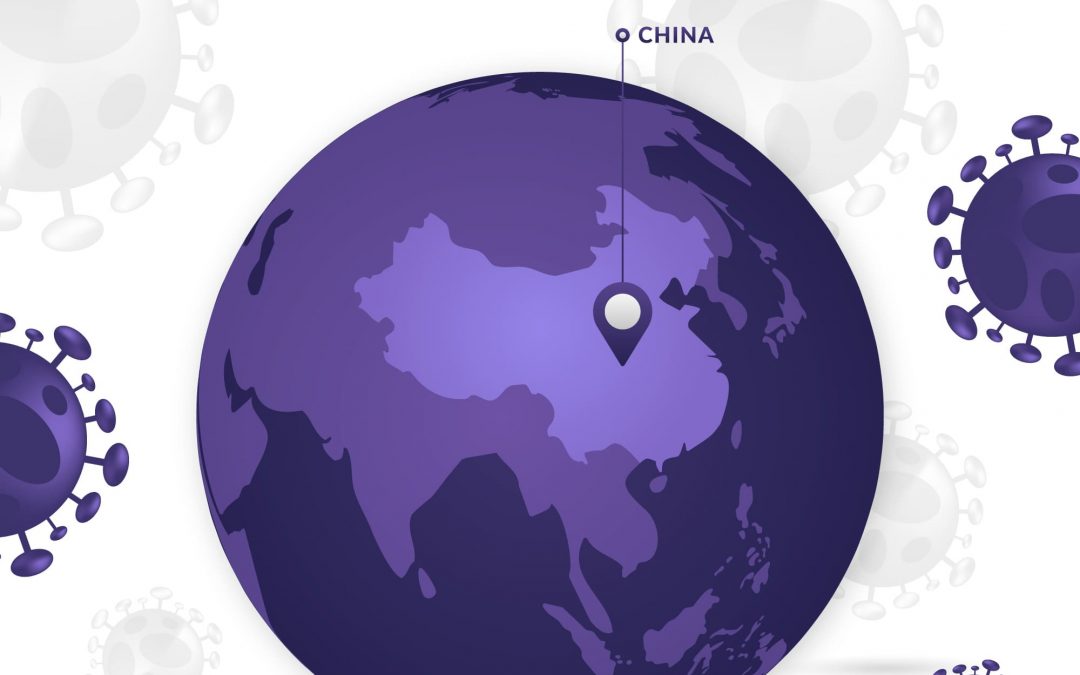
The origins of COVID are mysterious. Even more so is the fact that China has been spared its worst horrors. Is there a genetic angle?
When the rest of the world – people and economies are falling like dominoes, China, the nursery of the virus, recorded very few COVID cases and deaths. What is more, its first-quarter GDP grew 18.3 percent year-on-year. So, what’s cooking?
The publicly cited explanations are these:
- China is authoritarian and can therefore enforce better discipline.
- It was decisive and efficient in controlling the pandemic as soon as it was detected.
- Chinese and other South East/East Asians have been wearing masks in public for many decades now
But here is why the virus should have wreaked far more damage than it should have (not wishing for it):
- The Chinese government may be more efficient, but the average Chinese citizen is as social and non-disciplined as the average Indian. So, maintaining the momentum of social distancing and other Corona mitigation measures is very difficult if not impossible.
- As of April 8, just 5 percent of the Chinese population has been vaccinated and vaccine shortages are being felt.
The hypothesis
So, I analysed COVID statistics on the hunch that the Corona virus with its rapid spread and dangerous mutations is a lab-created biogenetic weapon. A form of biological warfare that targets people with specific genetic profiles AND/OR spares those with other specific genetic profiles. It stands to reason that the initiator of biological warfare wouldn’t want to fall prey to one’s own weapon. So, if the Chinese launched a bio-genetic weapon, what would be their pre-emptive defence?
Genes!
I’m not a geneticist, but haplogroup O-M122 deserves scrutiny. A haplogroup is a genetic population group of people who share a common ancestor on the paternal or maternal sides.
The Han account for 92 percent of China’s 1.4 bn population and 50-80 percent of them belong to O-M122. Not just the Chinese, but virtually the whole of South-East Asian/East Asian populations have significant portions of the same ancestry.
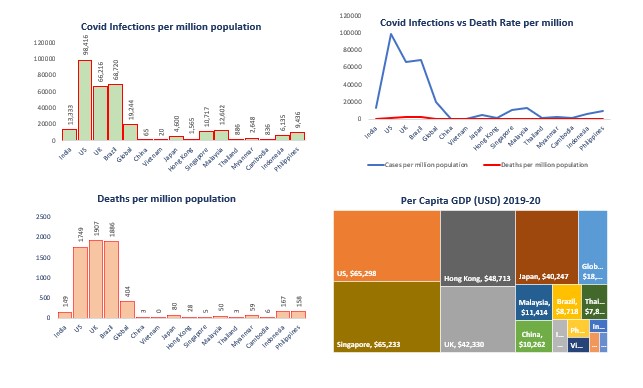
What I did find interesting was that most of the countries in this region recorded very low COVID-19 cases and fatalities per million population. (As of April 29)
| Country | Cases per million population | Deaths per million population | Average Age, 2019-20 | Per Capita GDP (USD) 2019-20 |
| India | 13333 | 148.55 | 26.8 | 2099.6 |
| US | 98415.6 | 1748.93 | 38.1 | 65297.52 |
| UK | 66216.22 | 1906.91 | 40.1 | 42330.1 |
| Brazil | 68720.38 | 1886.26 | 33.5 | 8717.9 |
| Global | 19243.6 | 404.116 | 29.6 | 18381 |
| South East | and East Asia | |||
| China | 64.73 | 3 | 37.4 | 10261.68 |
| Vietnam | 20 | 0.4 | 33 | 2715.28 |
| Japan | 4600.16 | 80 | 48.4 | 40246.88 |
| Hong Kong | 1565.25 | 27.82 | 45.6 | 48713.47 |
| Singapore | 10,716.84 | 5 | 42.2 | 65233.28 |
| Malaysia | 12,601.88 | 50 | 29.2 | 11414.21 |
| Thailand | 886.48 | 3 | 40.1 | 7806.74 |
| Myanmar | 2648.18 | 59.42 | 29 | 1408 |
| Cambodia | 835.75 | 5.81 | 26.4 | 1643.12 |
| The | Exceptions | |||
| Indonesia | 6134.52 | 166.72 | 31.8 | 4135.57 |
| Philippines | 9,435.71 | 157.55 | 25.7 | 3485.08 |
Courtesy: Ashutosh Sharma
As the table shows, irrespective of considerable differences in average age or Per Capita GDP levels amongst themselves, South East and East Asian countries depict remarkably low incidence of cases and deaths per million population. These statistics stand in sharp contrast with the sad story across the rest of the globe.
The only real exceptions are Indonesia and the Philippines. I don’t have a conclusive explanation given my lack of expertise in genetics. But what I know is that these two countries are genetically very diverse thanks to the intermingling of aboriginal peoples with East Asian migrants, followed by the Arabs and then the Europeans. As of this moment, we do not have the resources to determine if those who died in these two countries owed their ancestry to the O-M122 haplogroup.

Photo by Rohan Chowdhury from Pexels
Let us extend these findings to India, with a focus on North Eastern states which have historically seen population inflows from China, South East Asia, and Tibet.
| State | Cases per million population | Deaths per million population |
| India | 13333 | 148.55 |
| Kerala | 43352 | 150.61 |
| Maharashtra | 39141 | 588.56 |
| North Eastern | States | |
| Nagaland | 5896.93 | 40 |
| Arunachal | 14204.76 | 50 |
| Mizoram | 5126.79 | 10 |
| Assam | 7896.44 | 40 |
| Meghalaya | 6140 | 60 |
| The | Exceptions | |
| Tripura | 9475.96 | 100 |
| Manipur | 11302.21 | 144.49 |
| Sikkim | 11996.77 | 229.40 |
North-Eastern states register considerably lower numbers of COVID cases and deaths. Of course, there are exceptions. I can conjecture that Sikkim has higher numbers because every new case/death would have a disproportionately high impact on a tiny population base of about 6.2 lakh. As for Tripura, it is closer in genetic and ethnic identity to Bengal than to the rest of the North-Eastern states. Of Manipur, I don’t really have a convincing explanation.
Overall, I am not 100 percent certain of my Chinese biogenetic weapon hypothesis, but it is surely more than plausible. Alongside my friends, I invite epidemiologists and geneticists to weigh in.
If you like what you read, please stay connected here

Recent Comments